Data product
Built on my own time
Designed and built alone, live · Next.js, n8n, Stripe
Quitter France: a matching engine over a hundred-plus facts per country
People answer a questionnaire, a matching engine scores fourteen countries against their profile, and they get a ranking, country pages and, if they pay, an audit report. The design problem: make a dense analytical dataset legible to someone who is not an analyst.
- 127verified facts per country, eleven axes
- 14 / 44countries and cities in the matching
- 28visa paths, with their conditions
01
Ranking and country pages
Every fact carries its source and its date, one current value per metric and country, so a table never shows two truths at once. The tax barometer ranks twelve countries on what you keep, with three income levels as tabs and France kept in the list as the reference row. A country page gives the key figures first, then indicator bars on a shared scale, then a comparison table against France with the difference as its own column.
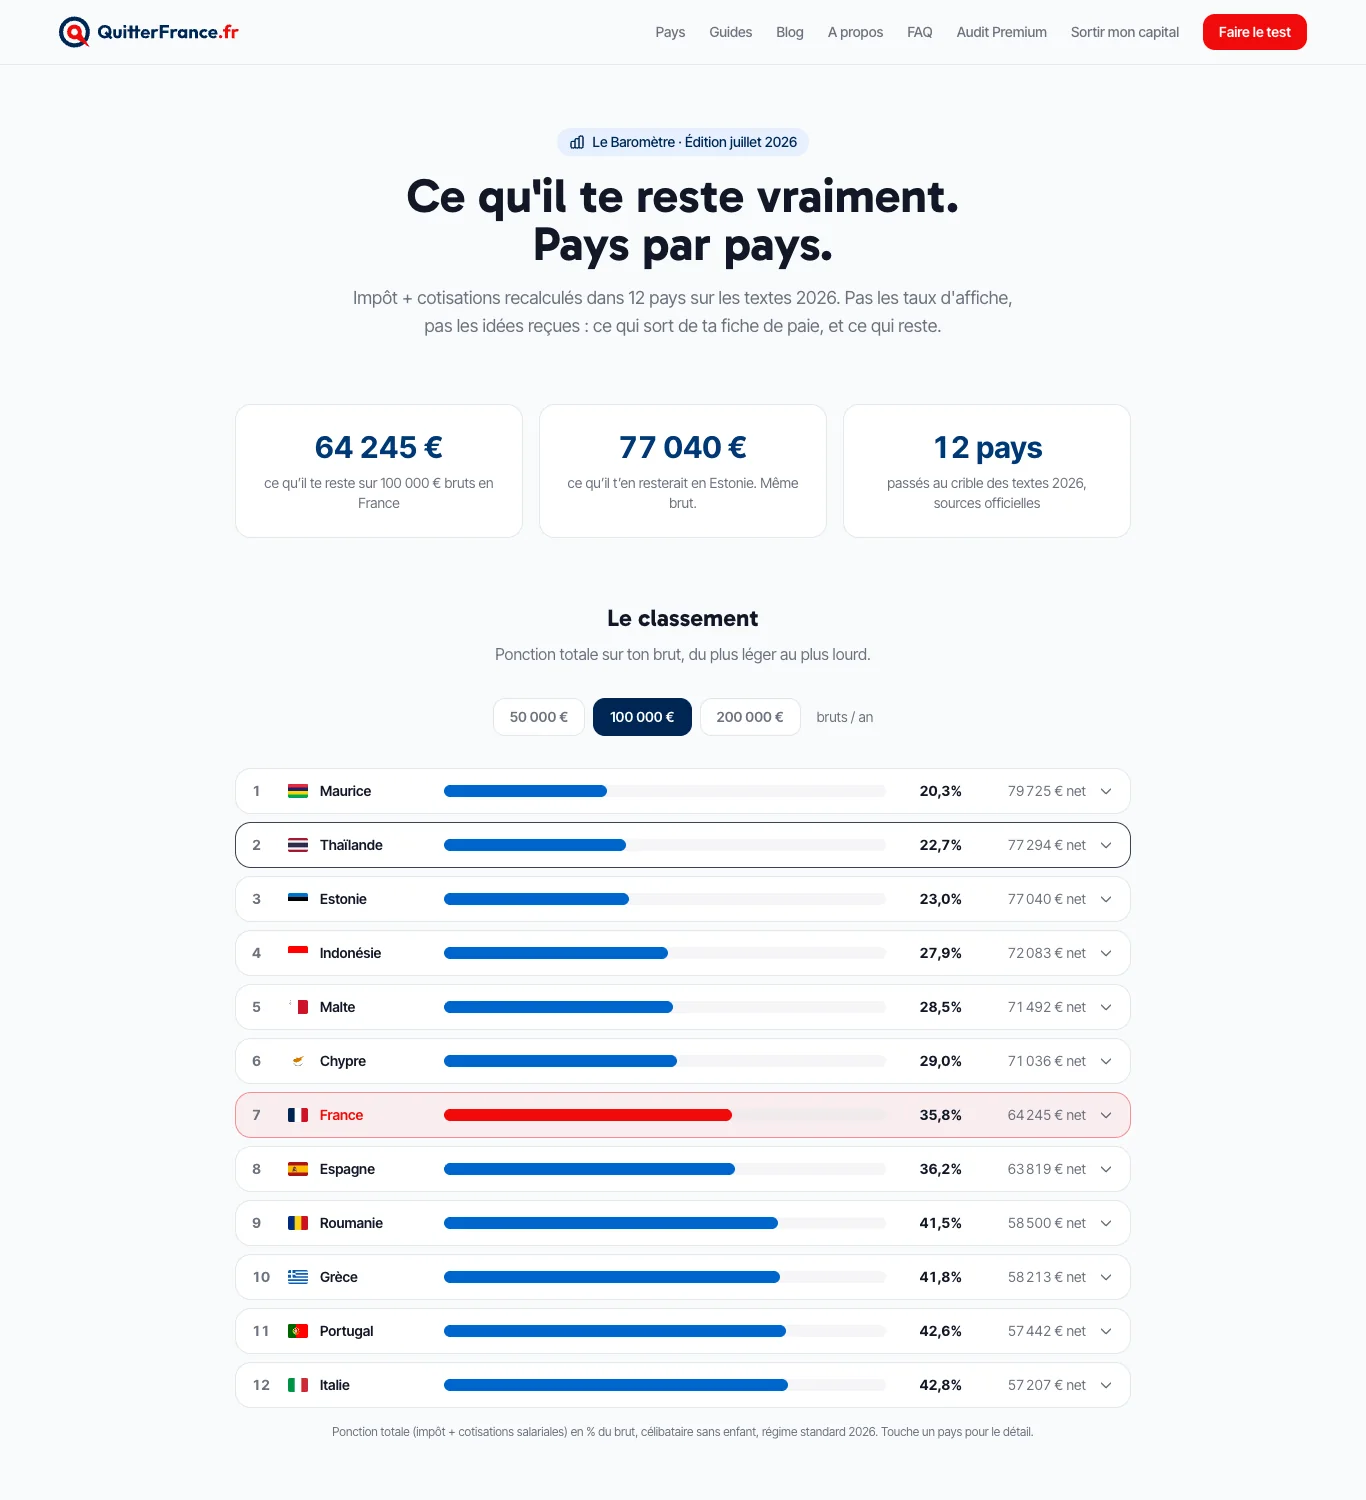
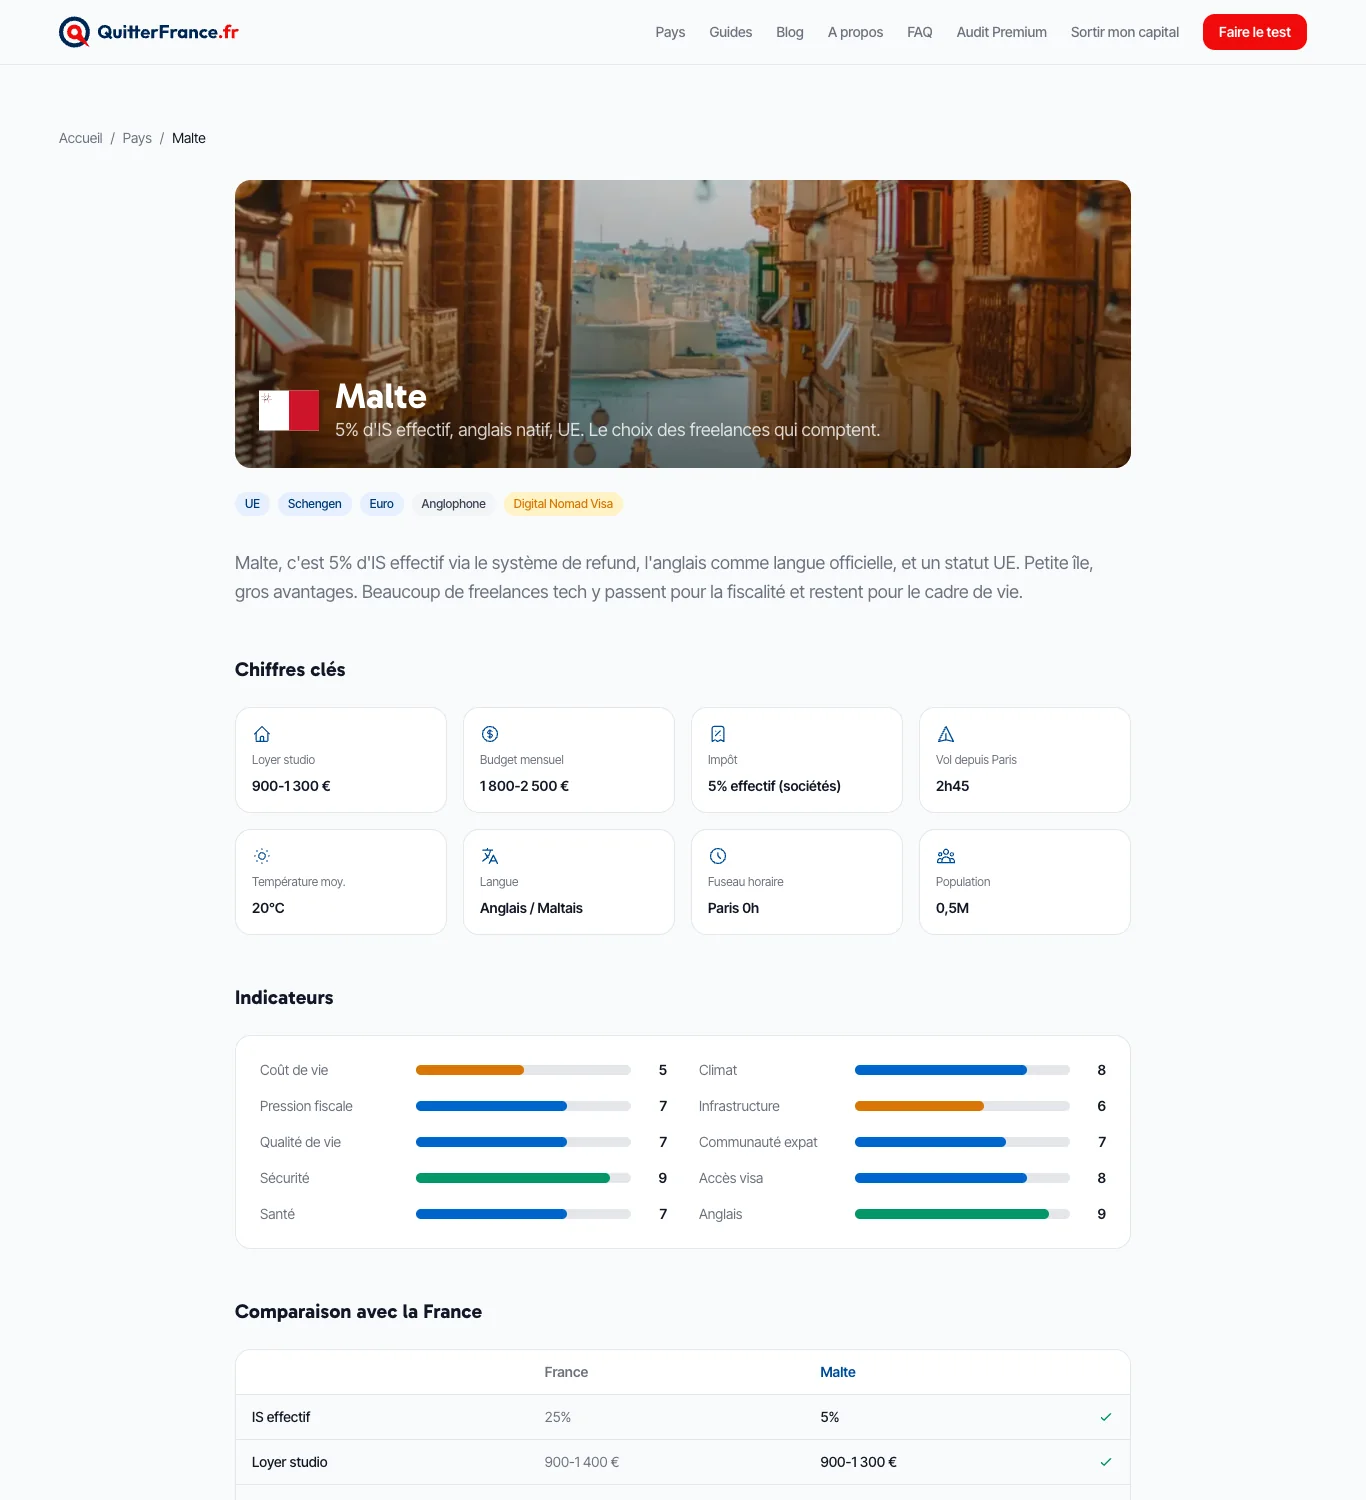
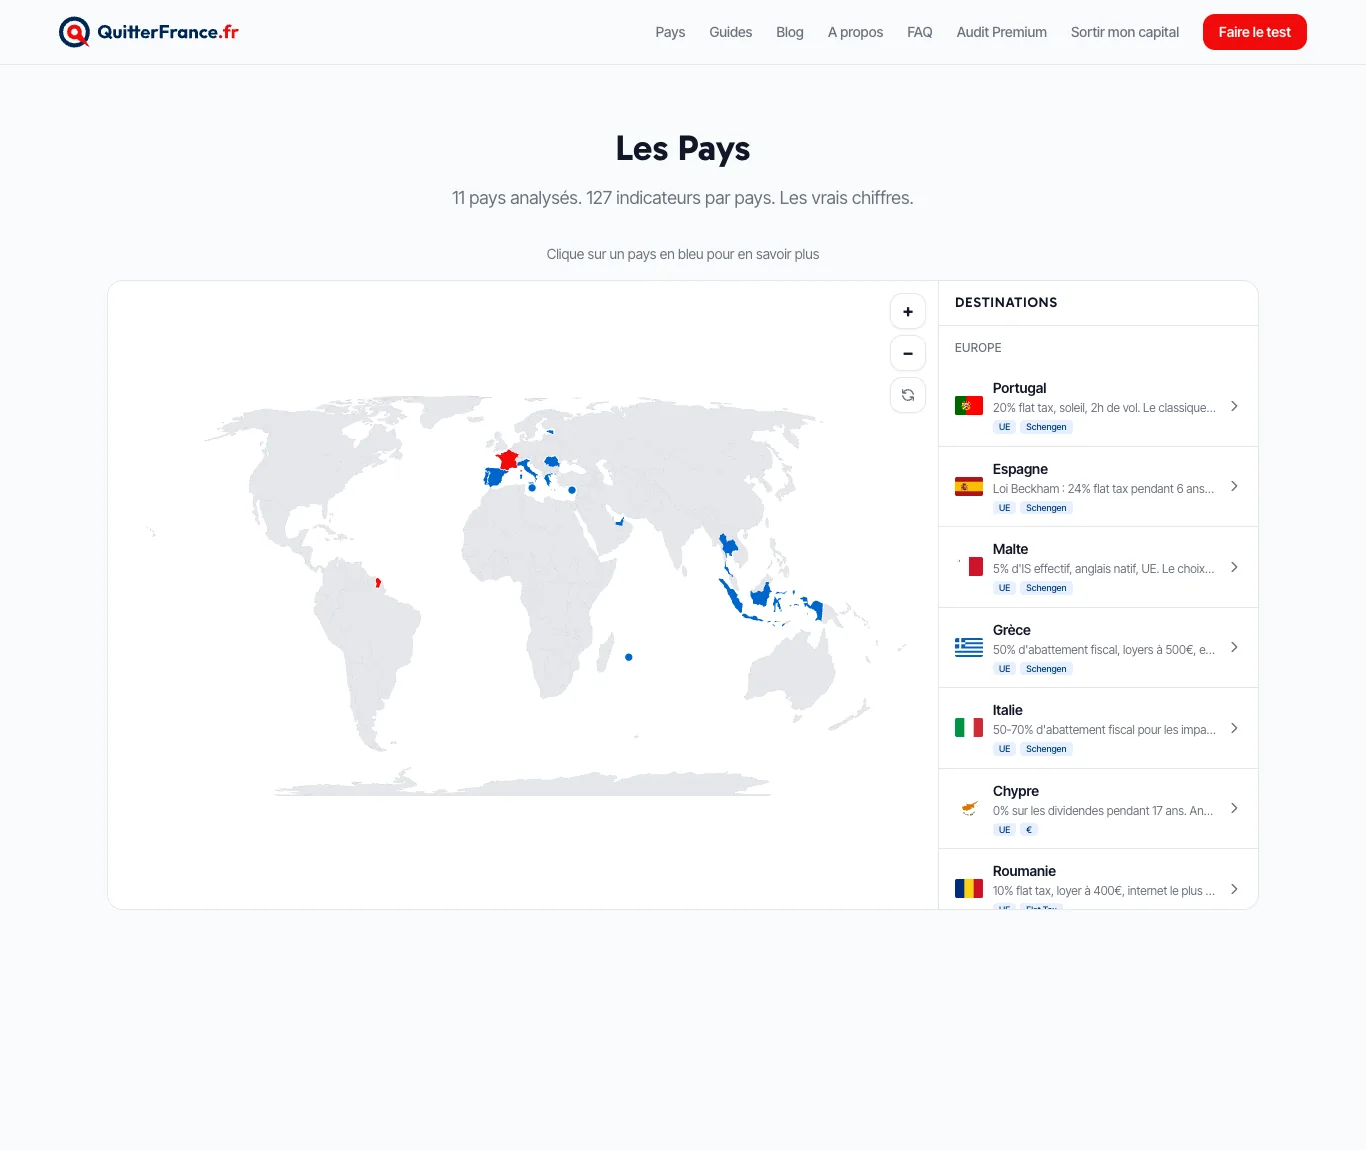
The tax barometer, the Malta country page, and the country index with its map.
02
The audit report
The paid report is generated for one person from the knowledge base and their answers. Its structure keeps dense data readable: a seven-axis analysis with bars on one scale, tax tables with a column that says what each figure means for the reader, a budget estimate at three levels, and a roadmap in four phases on a timeline. Every warning is paired with a mitigation, and the report is not allowed to be vaguer than the data.
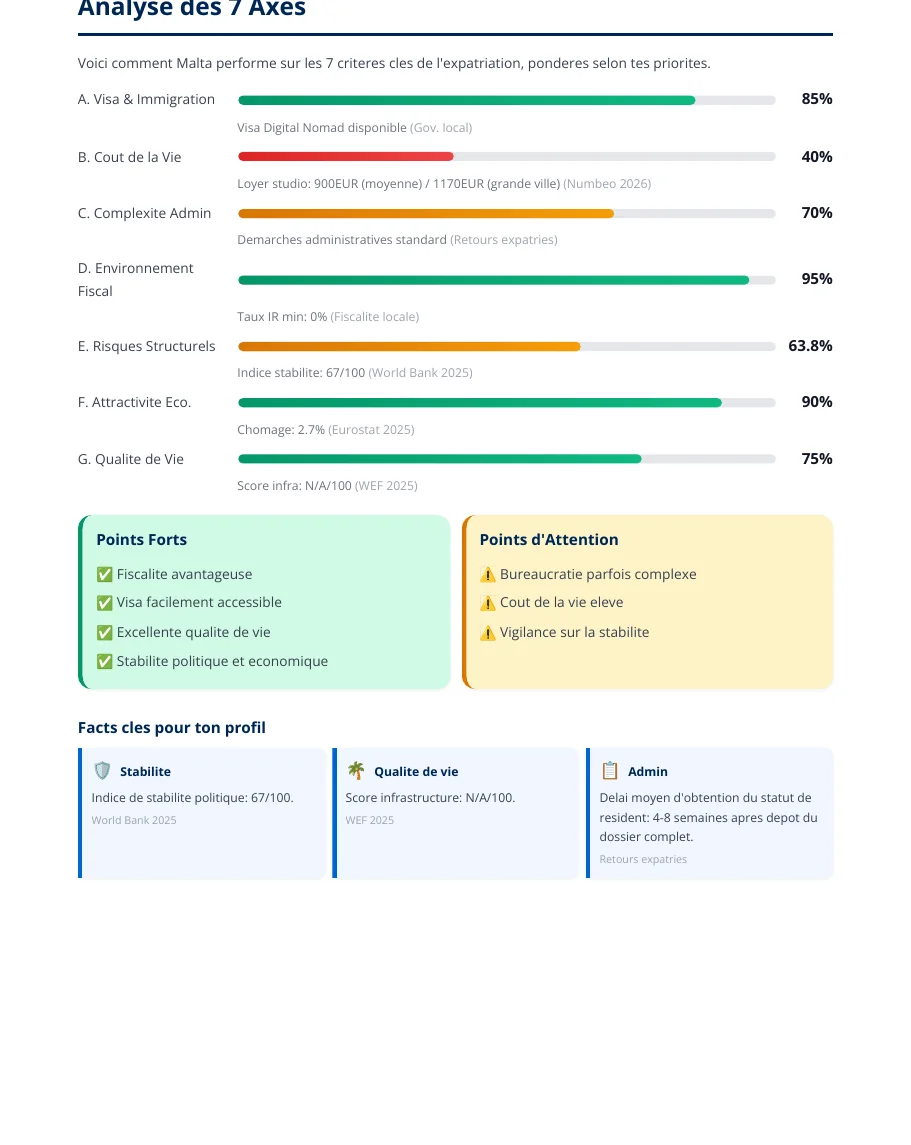
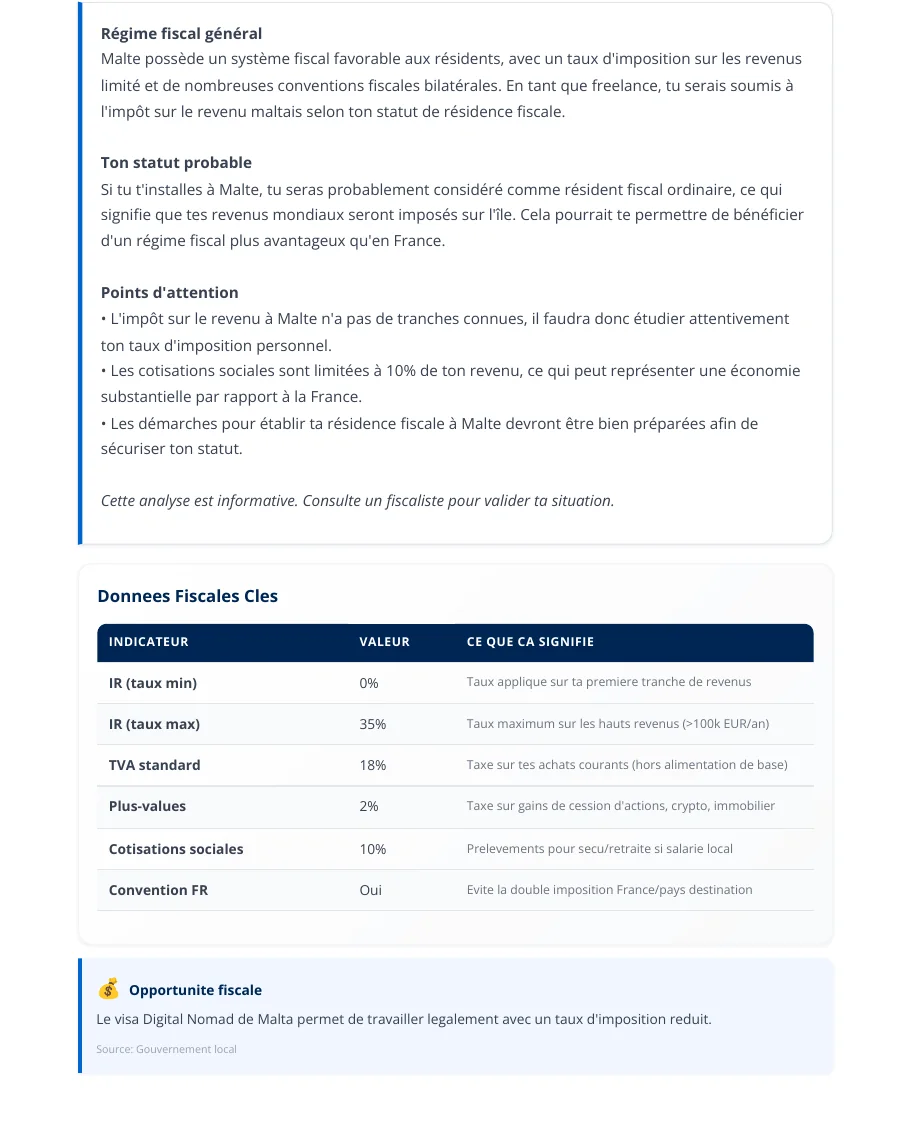
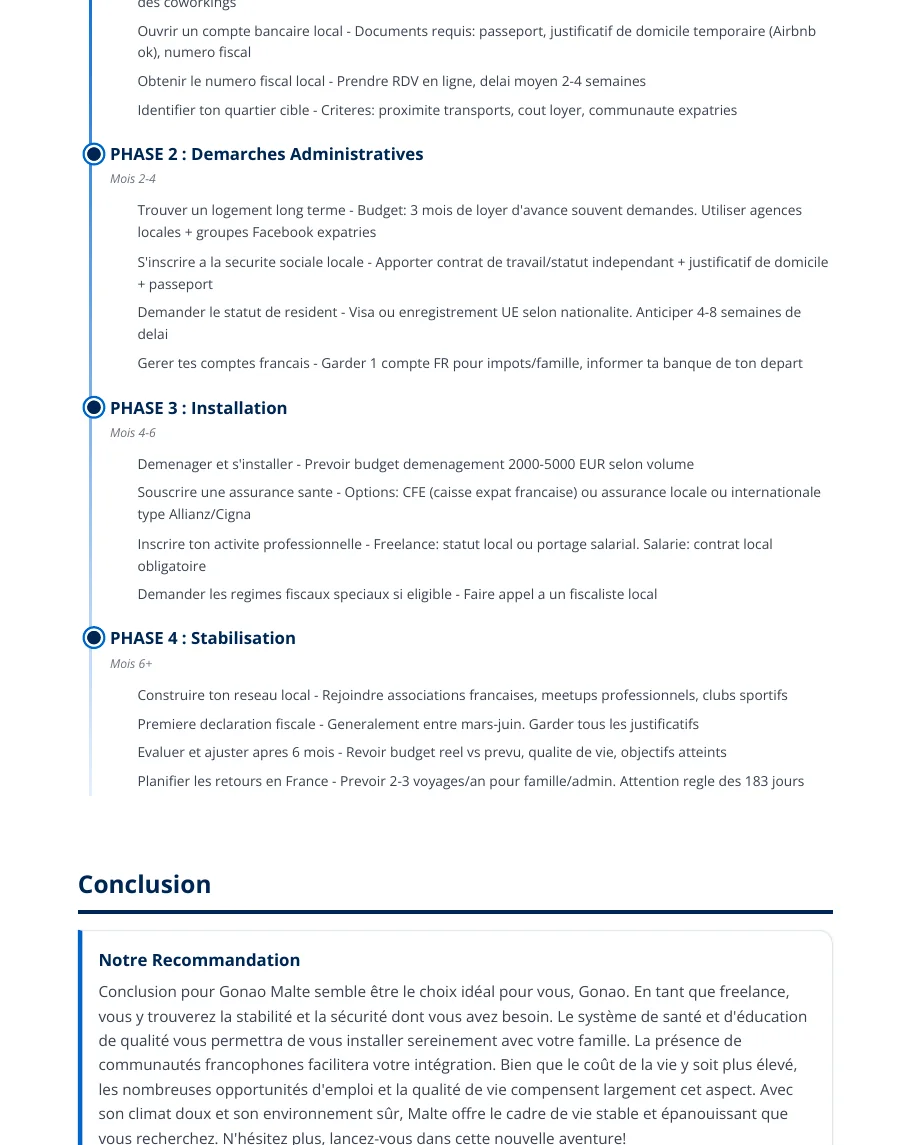
Three pages of the audit report: the seven-axis analysis, the tax tables, the phased roadmap.